8 Cochran Mantel Haenszel Test
The CMH procedure tests for conditional independence in partial contingency tables for a 2 x 2 x K design. However, it can be generalized to tables of X x Y x K dimensions.
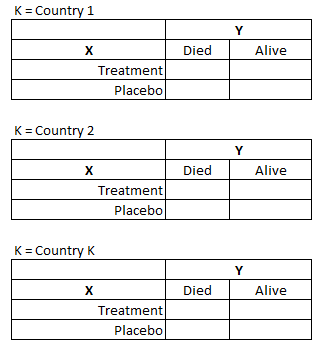
8.1 Naming Convention
For the remainder of this document, we adopt the following naming convention when referring to variables of a contingency table:
- X = exposure
- Y = response
- K = control
8.2 Scale
The scale of the exposure (X) and response (Y) variables dictate which test statistic is computed for the contingency table. Each test statistic is evaluated on different degrees of freedom (df):
-
General associationstatistic (X and Y both nominal) results in(X-1) * (Y-1) dfs -
Row meanscores statistic (X is nominal and Y is ordinal) results inX-1 dfs -
Nonzero correlationstatistic (X and Y both ordinal) results in1 df
8.3 Testing Strategy
8.3.1 Data
To begin investigating the differences in the SAS and R implementations of the CMH test, we decided to use the CDISC Pilot data set, which is publicly available on the PHUSE Test Data Factory repository. We applied very basic filtering conditions upfront (see below) and this data set served as the basis of the examples to follow.
8.3.2 Schemes
In order to follow a systematic approach to testing, and to cover variations in the CMH test, we considered the traditional 2 x 2 x K design as well as scenarios where the generalized CMH test is employed (e.g. 5 x 3 x 3).
We present 5 archetype test scenarios that illustrate diverging results, possibly related to sparse data and possibly considered edge cases.
| Number | Schema | Variables | Relevant Test | Description |
|---|---|---|---|---|
| 1 | 2x2x2 | X = TRTP, Y = SEX, K = AGEGR1 | General Association | TRTP and AGEGR1 were limited to two categories, overall the the groups were rather balanced |
| 3 | 2x2x3 | X = TRTP, Y = SEX, K = RACE | General Association | Gives back NaN in R because RACE is very imbalanced |
| 6 | 2x5x2 | X = TRTP, Y = AVAL, K = SEX | Row Means | Compare Row Means results for R and SAS because Y is ordinal |
| 9 | 3x5x17 | X = TRTP, Y = AVAL, K = SITEID | Row Means | SITEID has many strata and provokes sparse groups, AVAL is ordinal, therefore row means statistic applies here, R threw an error |
| 10 | 5x3x3 | X = AVAL, Y = AGEGR1, K = TRTP | Correlation | X and Y are ordinal variables and therefore the correlation statistics has to be taken here |
8.4 Implementation
8.4.1 CMH in SAS
The cmh test is calculated in SAS using the PROC FREQ procedure. By default, it outputs the chi square statistic, degrees of freedom and p-value for each of the three alternative hypothesis: general association, row means differ, and nonzero correlation. It is up to the statistical analyst or statistician to know which result is appropriate for their analysis.
When the design of the contingency table is 2 x 2 x K (i.e, X == 2 levels, Y == 2 levels, K >= 2 levels), the Mantel-Haenszel Common Odds Ratio (odds ratio estimate, 95% CI, P-value) and the Breslow-Day Test for Homogeneity of the Odds Ratios (chi-square statistic, degrees of freedom, P-value) are also output.
Below is the syntax to conduct a CMH analysis in SAS:
Proc freq data = filtered_data;
tables K * X * Y / cmh;
* the order of K, X, and Y appearing on the line is important!;
run;
8.4.2 In R
We did not find any R package that delivers all the same measures as SAS at once. Therefore, we tried out multiple packages:
8.4.2.1 mantelhaen.test()
This is included in a base installation of R, as part of the stats package. Requires inputting data as a table or as vectors.
mantelhaen.test(x = data$x, y = data$y, z = data$k)8.4.2.2 CMHtest()
The vcdExtra package provides results for the generalized CMH test, for each of the three model it outputs the Chi-square value and the respective p-values. Flexible data input methods available: table or formula (aggregated level data in a data frame).
8.4.2.2.1 Forked Version - Solution for sparse data
To tackle the issue with sparse data it is recommended that a use of solve() is replaced with MASS::ginv. This was implemented in the forked version of vcdExtra which can be installed from here:
devtools::install_github("mstackhouse/vcdExtra")However, also the forked version for the vcdExtra package works only until a certain level of sparsity. In case of our data, it still works if the data are stratified by the pooled Site ID (SITEGR1 - 11 unique values) whereas using the unpooled Site ID (SITEID - 17 unique values) also throws an error.
8.4.2.2.2 Inconsistent Results
Exploring the vcdExtra package in detail we realized that there seems to be a bug in the implementation which we would like to highlight here.
Using an independent data example (3x2x2), we first ran the CMH test through SAS and obtained the following:
# Cochran-Mantel-Haenszel Statistics (Based on Table Scores)
# Statistic    Alternative Hypothesis    DF       Value      Prob
# ---------------------------------------------------------------
#   1        Nonzero Correlation        1      6.4586    0.0110
#   2        Row Mean Scores Differ     2     26.0278    <.0001
#   3        General Association        2     26.0278    <.0001
When we specify the analysis in R this way, we get the following results:
CMHtest(Freq~x+y|k, data=test_eg, overall=TRUE, details=TRUE)$ALL$table## Chisq Df Prob
## cor 6.458575 1 0.01104181
## rmeans 26.02779 2 2.229135e-06
## cmeans 6.458575 1 0.01104181
## general 26.02779 2 2.229135e-06By default, all 3 tests (and a 4th) are output. The results seem to match.
When we specify the analysis using an explicit type argument, we get the following results:
CMHtest(Freq~x+y|k, data=test_eg, overall=TRUE, details=TRUE, type = "ALL")$ALL$table## Chisq Df Prob
## general 26.02779 1 3.365374e-07
## rmeans 26.02779 2 2.229135e-06
## cmeans 6.458575 1 0.01104181
## cor 6.458575 2 0.03958569While we’ve essentially asked for everything (i.e. the default), albeit explicitly, the results do not match. The degrees of freedom seem to be mismatched with results in wrong p-values (if we assume SAS is the gold standard)
Similarly, if we specify we would only like certain tests returned, the results seem dependent on the order of specification:
# Order: cor, general, rmeans
CMHtest(Freq~x+y|k, data=test_eg, overall=TRUE, details=TRUE, types=c("cor","general","rmeans"))$ALL$table
## Chisq Df Prob
## cor 6.458575 1 0.01104181
## general 26.02779 2 2.229135e-06
## rmeans 26.02779 2 2.229135e-06
# Order: rmeans, general, cor
CMHtest(Freq~x+y|k, data=test_eg, overall=TRUE, details=TRUE, types=c("rmeans","general","cor"))$ALL$table
## Chisq Df Prob
## rmeans 26.02779 1 3.365374e-07
## general 26.02779 2 2.229135e-06
## cor 6.458575 2 0.03958569Impact: In the event of a 2x2xK design, all 3 test statistics, degrees of freedom and p-values are the same. Therefore, specifying a 2x2xK analysis any of the ways above results in correct “answer”, though they are technically mixed up.
This is why we chose as a 3x2x2, so we can clearly where things are mixed up.
We are planning to submit an issue to the vcdExtra github for the author’s review.
8.5 Results
Here the results can be seen:
8.5.1 CMH Statistics
| Cochran-Mantel-Haenszel Test Statistics | |||||||
|---|---|---|---|---|---|---|---|
| Schema | Test | Chi-Square | df | P-Value | |||
| R | SAS | R | SAS | R | SAS | ||
| 1 | Correlation | 0.0176704 | 0.017670400 | 1 | 1 | 0.8942487 | 0.89424870 |
| Row Means | 0.0176704 | 0.017670400 | 1 | 1 | 0.8942487 | 0.89424870 | |
| General Association | 0.0176704 | 0.017670400 | 1 | 1 | 0.8942487 | 0.89424870 | |
| 6 | Correlation | 0.13012 | 1.1472 | 1 | 1 | 0.71831 | 0.2841 |
| Row Means | 0.13012 | 1.1472 | 1 | 1 | 0.71831 | 0.2841 | |
| General Association | 1.5771 | 2.5672 | 4 | 4 | 0.81397 | 0.6326 | |
| 10 | Correlation | 0.8715295 | 2.738160852 | 1 | 1 | 0.3505322 | 0.09797747 |
| Row Means | 3.044527 | 4.407010917 | 4 | 4 | 0.5504018 | 0.35371641 | |
| General Association | 5.730538 | 5.730538193 | 8 | 8 | 0.6773861 | 0.67738613 | |
As it can be seen, there are two schemata where R does not provide any results:
| Cochran-Mantel-Haenszel Test Statistics | |||||||
|---|---|---|---|---|---|---|---|
| Schema | Test | Chi-Square | df | P-Value | |||
| R | SAS | R | SAS | R | SAS | ||
| 3 | Correlation | NaN | 0.002787130 | 1 | 1 | NaN | 0.95789662 |
| Row Means | NaN | 2.386069847 | 2 | 2 | NaN | 0.30329938 | |
| General Association | NaN | 2.386069847 | 2 | 2 | NaN | 0.30329938 | |
| 9 | Correlation | Error | 0.085443119 | Error | 1 | Error | 0.77005225 |
| Row Means | Error | 2.476313667 | Error | 2 | Error | 0.28991809 | |
| General Association | Error | 7.033878442 | Error | 8 | Error | 0.53298189 | |
Reason for NaN in schema 3: Stratum k = AMERICAN INDIAN OR ALASKA NATIVE can not be compared because there are only values for one treatment and one gender.
Reason for Error 4:
For large sparse table (many strata) CMHTest will occasionally throw an error in solve.default(AVA) because of singularity
8.6 Summary and Recommendation
Having explored the available R packages to calculate the CMH statistics, using R can only be recommended if the analysis design is equivalent to 2 x 2 x K. Then, the base mantelhaen.test() function as well as the vcdExtra package show reliable results which are equal to the output of the SAS function. The same is true for the common odds ratio even though there is a marked difference in decimals.
For the generalized version of the cmh test no R package can be recommended so far. SAS and R outputs differ substantially (possibly due to the underlying subroutines or functions) and the vcdExtra package seems to deliver inconsistent results outside the 2 x 2 x K design.